fASL Tutorial #1: Background
Note
This section is still under construction. Check back soon!
The brain’s metabolic activity requires nutrients to function. As function goes up, so does the demand for oxygen and glucose and the brain tries to make up the demand by dilating the arterioles, which results in an increase in blood flow to the area. There is a complicated chain of chemical signals that lead to this vasodilation but we will not talk about that here. Importantly, though, the increase in blood flow tends to overcompensate the demand in the short term.
This property of the brain’s vasculature is very useful in that it makes blood flow a very good marker of neuronal activity. It is spatially coarse and a bit slow, but detecting changes in flow is a great way to detect changes in activity. From a clinical point of view, this is very valuable as it tells you if brain tissue is healthy or not. For example, tumors are very active and demand a lot of blood flow. Some neurodegenerative diseases reduce the blood supply.
From a cognitive neuroscience point of view, blood flow is a great way to map brain function in the brain. We can look for changes in blood flow during a mental task and those changes can tell us which regions of the brain were responsible for that mental task. Neuroscientists have been using this sort of idea since the 80’s, primarily through PET scanning.
So, how does one measure blood flow in the brain?
One way is to measure the velocity of arterial blood with doppler ultrasound, or phase contrast MRI, but that’s not very good for brain mapping. A better way to get images of blood flow is to inject some sort of tracer and then collect images of the tracer and see how much tracer accumulated in each region over time. More tracer accumulation implies more flow to the area.
At this point, let’s take a moment to make a distinction between blood flow and perfusion. Technically speaking, blood flow refers to the blood that is in the larger vasculature, whereas perfusion refers to the blood that gets into capillaries and exchanges nutrients and water into the tissue. Perfusion is generally a finer indicator of where brain activity happens.
At any rate, tracer injections were used since the fifties to measure perfusion in different organs. PET scanners use radioactive water to measure perfusion, in addition to being able to trace radioactively labeled glucose or receptor binding molecules. MRI offers exquisite spatial resolution and detail, and it can also be used to measure perfusion by injecting contrast agents that will affect the MR signal, typically different gadolinium compounds.
However, injecting tracers is not very practical. There is the obvious fact of having to stick a needle in a participant, then there is radiation or toxicity, and the fact that it takes time for the tracer to leave the body before we can repeat the experiment… and then there is the fact that that the injection’s contents (‘bolus’) spreads out before it gets to the brain and it makes it harder to calculate the perfusion rate.
And that’s where arterial spin labeling (ASL) comes in. Imagine that instead of injecting a tracer, we could create a tracer just upstream of the brain (or another organ) without actual injection. ASL does exactly that by using radiofrequency pulses that change the magnetic state of the water molecules in the blood just before they get into the brain. As they get into the brain, they will affect the signal intensity of the image.
There are multiple schemes of pulses and image acquisitions that you can use, but the most popular and effective one at this time is the “pseudo-continuous” ASL technique, depicted in the cartoon.
Overview
Throughout the 1980’s and early 1990’s, neuroimaging researchers would measure the contrast between brain tissues using methods such as positron emission tomography, or PET. This involves injecting a radioactive glucose tracer that is absorbed by neurons when they fire. By taking images of the brain under different experimental conditions, such as seeing a flashing checkerboard or doing a cognitively demanding problem, researchers could see which regions were more active compared to other regions.
However, this method is invasive, and the idea of being injected with a radioactive tracer deterred many people from being subjects in such experiments. By the early 1990’s, an alternative imaging technique called magnetic resonance imaging (MRI) had become much faster and less expensive, and researchers were looking for a way to make it more widespread for clinical use. It was soon discovered that more deoxygenated blood leads to a decrease in the signal measured from a brain region. An increase in oxygenated blood, on the other hand, increases the signal - and this increase in oxygenated blood was later shown to be correlated with increased neural firing. This change in signal is known as blood oxygen level dependent signal (or BOLD signal).
An alternative method to image brain activity is to look at the perfusion rate, since perfusion also goes up when the brain is more active. Adding radioactive water to the blood could be used to measure the perfusion rate using PET, and this could be used as a surrogate for brain activity.
Instead of injecting a tracer into the blood, however, we can “create” a tracer in the blood by changing its magnetization state. Arterial Spin Labeling (ASL) uses radiofrequency pulses to continuously excite the inflowing blood - usually at the neck. After a couple of seconds (an interval referred to as the bolus arrival time), a labeled image of the brain is acquired which is sensitized to pick up signal from the labeled blood. In order to quantify how much of the labeled blood has perfused the tissue, a control image (without the label) is acquired to compare against the labeled image.

Animation by Luis Hernandez-Garcia
However, CASL is relatively slow, difficult to implement on clinical scanners, and is susceptible to magnetization transfer effects. An alternative method called pseudo-Continuous Arterial Spin Labeling (p-CASL) applies a series of short radiofrequency pulses at a target slice, which achieves the same efficiency as CASL, but with lower magnetiziation transfer effects and lower SAR.
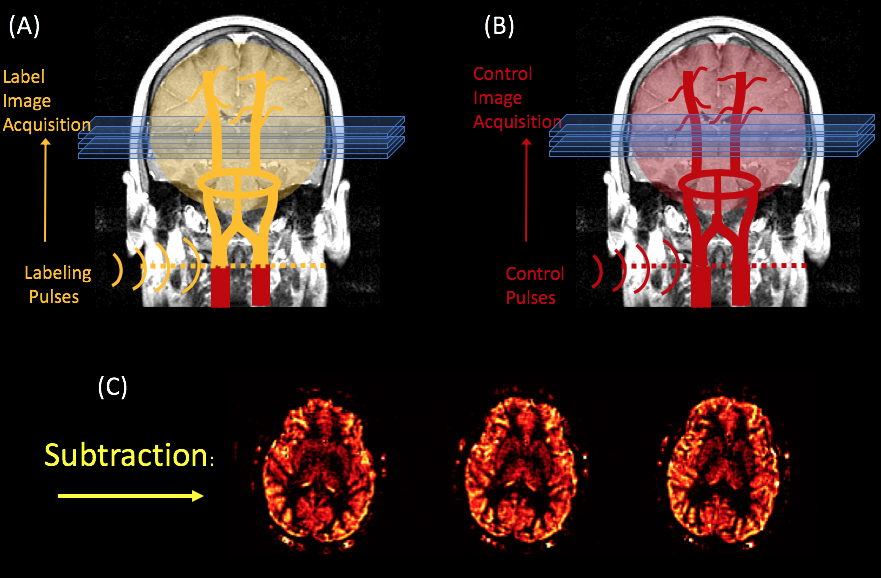
An illustration of the p-CASL method. A radiofrequency pulse inverts the spins of arterial water as it crosses a plane through the neck, after which a “label” image is acquired (A). A second “control” image is acquired without the label (B). The subtraction of these two images yields a perfusion weighted image (C). Figure created by Luis Hernandez-Garcia.
ASL vs. BOLD fMRI
Although both ASL and BOLD contrast are used to measure brain activity, there are several important differences between the two:
ASL noise is whiter than BOLD noise (Wang 2003).
Changes in perfusion are more localized to the parenchyma, whereas BOLD changes are tied to the veins and venules (Duong 2002).
It takes longer to collect a single ASL image - around 1.2-2.5 seconds, versus 500ms for BOLD images acquired with multiband.
We acquire fewer slices at a time with ASL, and the slices tend to be thicker (i.e., the spatial resolution is lower compared to BOLD imaging).
ASL signal is cleaner than what is normally observed in BOLD data. This is illustrated in the image given on the right which shows the results of an experiment that was first conducted using ASL, and then repeated using BOLD.
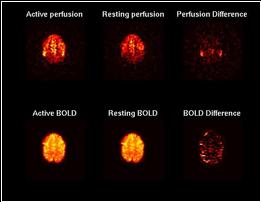
The top row shows ASL images and the bottom one shows BOLD images. Both used a TR of 4 seconds and were generated using spiral acquisition. The left column of images were averaged over 4 minutes of rest, while the middle column of images were averaged over four minutes of finger tapping. The right column shows the difference of the left two columns without modeling, filtering, or regression.
Next Steps
Now that you’ve become familiar with different approaches to ASL analysis, click on the Next button to learn how to download ASL software and a sample dataset to analyze.