fMRI Tutorial #5: Statistics and Modeling
Overview
Now that the first functional run has been preprocessed, we can fit a model to the data. To understand how model fitting works, we need to review some fundamentals such as the General Linear Model, the BOLD response, and what a time-series is. Each of these topics are discussed in the following table of contents.
After you have reviewed those concepts, you are then ready to run a first-level analysis using FEAT. The figure below illustrates how we will be fitting a model to the data.
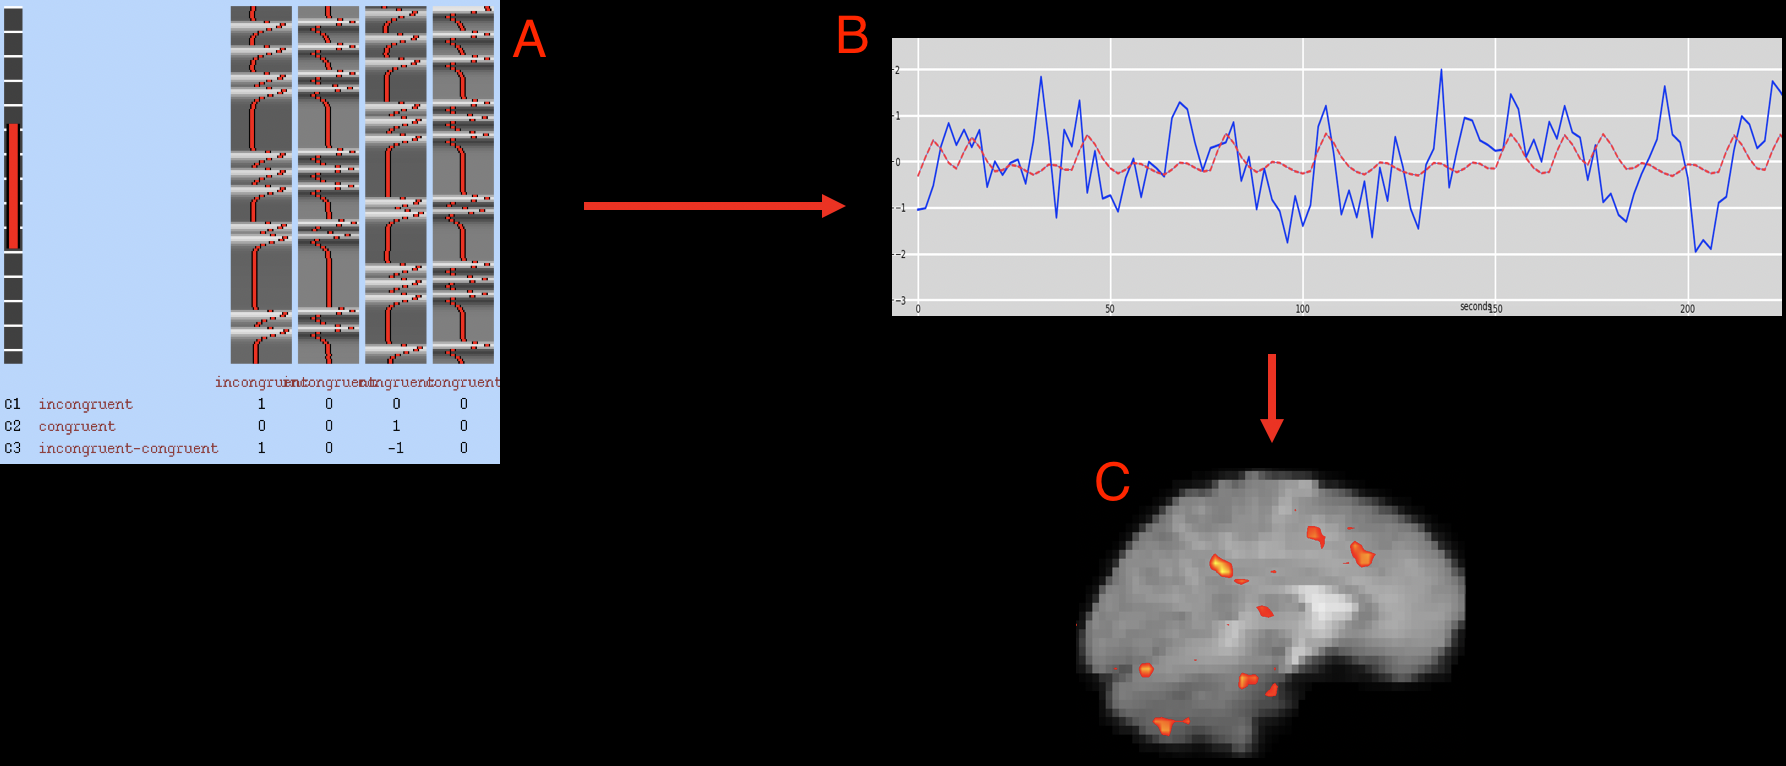
After a model has been constructed indicating what the BOLD response should look like (A), that model is then fit to the time-series at each voxel (B). How well the model fits (also known as the goodness of fit) can then be represented on the brain with statistical maps, with brighter intensities signifying a better model fit. These statistical maps can then be thresholded to show only the voxels with a statistically significant model fit (C).
First-Level Analysis
Note
Understanding model fitting and first-level analysis can be challenging. Don’t be discouraged if you don’t understand everything the first time you read the chapters; keep at it, and the concepts will become clearer with time and practice.