Introduction to AFNI
This course will show you how to analyze an fMRI dataset from start to finish. We will begin by downloading a sample dataset and inspecting the anatomical and functional images for each subject. We will then preprocess the data, which removes noise and enhances the signal in the images. Once the images have been preprocessed, we will create a model representing what we think the BOLD signal, a measure of neural activity, should look like in our images. During model fitting we compare this model with the signal in different areas of the image. This model fit is a measure of the strength of the signal under different conditions - for example, we can take the difference of the signal between conditions A and B of the experiment to see which condition leads to a larger BOLD response.
Once a model has been created for each subject and the BOLD response has been estimated for each condition, we can do any kind of group analysis we like: Paired t-tests, between-group t-tests, interactions, and so on. The goal of this course is to calculate a simple within-subjects contrast between two conditions, and test whether it is significant across subjects. You will also learn how to create figures showing whole-brain analyses, similar to what you see published in the neuroimaging journals, and how to do a region of interest (ROI) analysis.
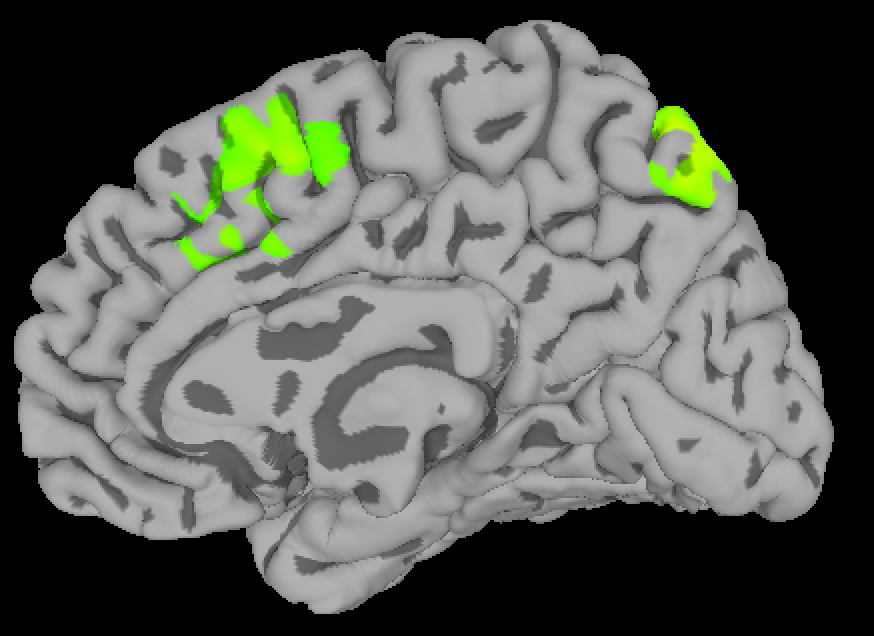
A figure showing group-level results from the data used in this course, represented as a z-statistic map. Brighter colors indicate larger z-scores. You will begin by preprocessing the raw data and end with creating a statistical map like this one.
This course is designed to build your confidence in working with fMRI data, increase your fluency with the basic terms of fMRI analysis, and help you make educated choices during each step. Some chapters have exercises to help you practice what you’ve learned and to prepare you for the next chapter. Once you have mastered the fundamentals of this course, you will be able to apply them to other datasets of your choosing.
Downloading and Installing AFNI
Depending on your computer’s operating system, you have several different options for downloading and installing the AFNI package. The AFNI website has instructions on how to install the software on Windows, Macintosh, and different versions of Linux; a tutorial video on how to install AFNI on a Macintosh operating system can be found here.
For Macintosh users, an installation app has been created that will streamline the process. Once you have downloaded it here, simply unpack the app and follow the instructions; I recommend keeping the default boxes checked.
If you do not have any of the required packages, such as R or Homebrew, the entire installation can take 1-2 hours. When it has completed, open a Terminal, type afni, and then press return. You should see the graphical user interface open. Close it, and from the same terminal type uber_subject.py and press return. You should see this window, which indicates that any Python-based programs should run without errors.
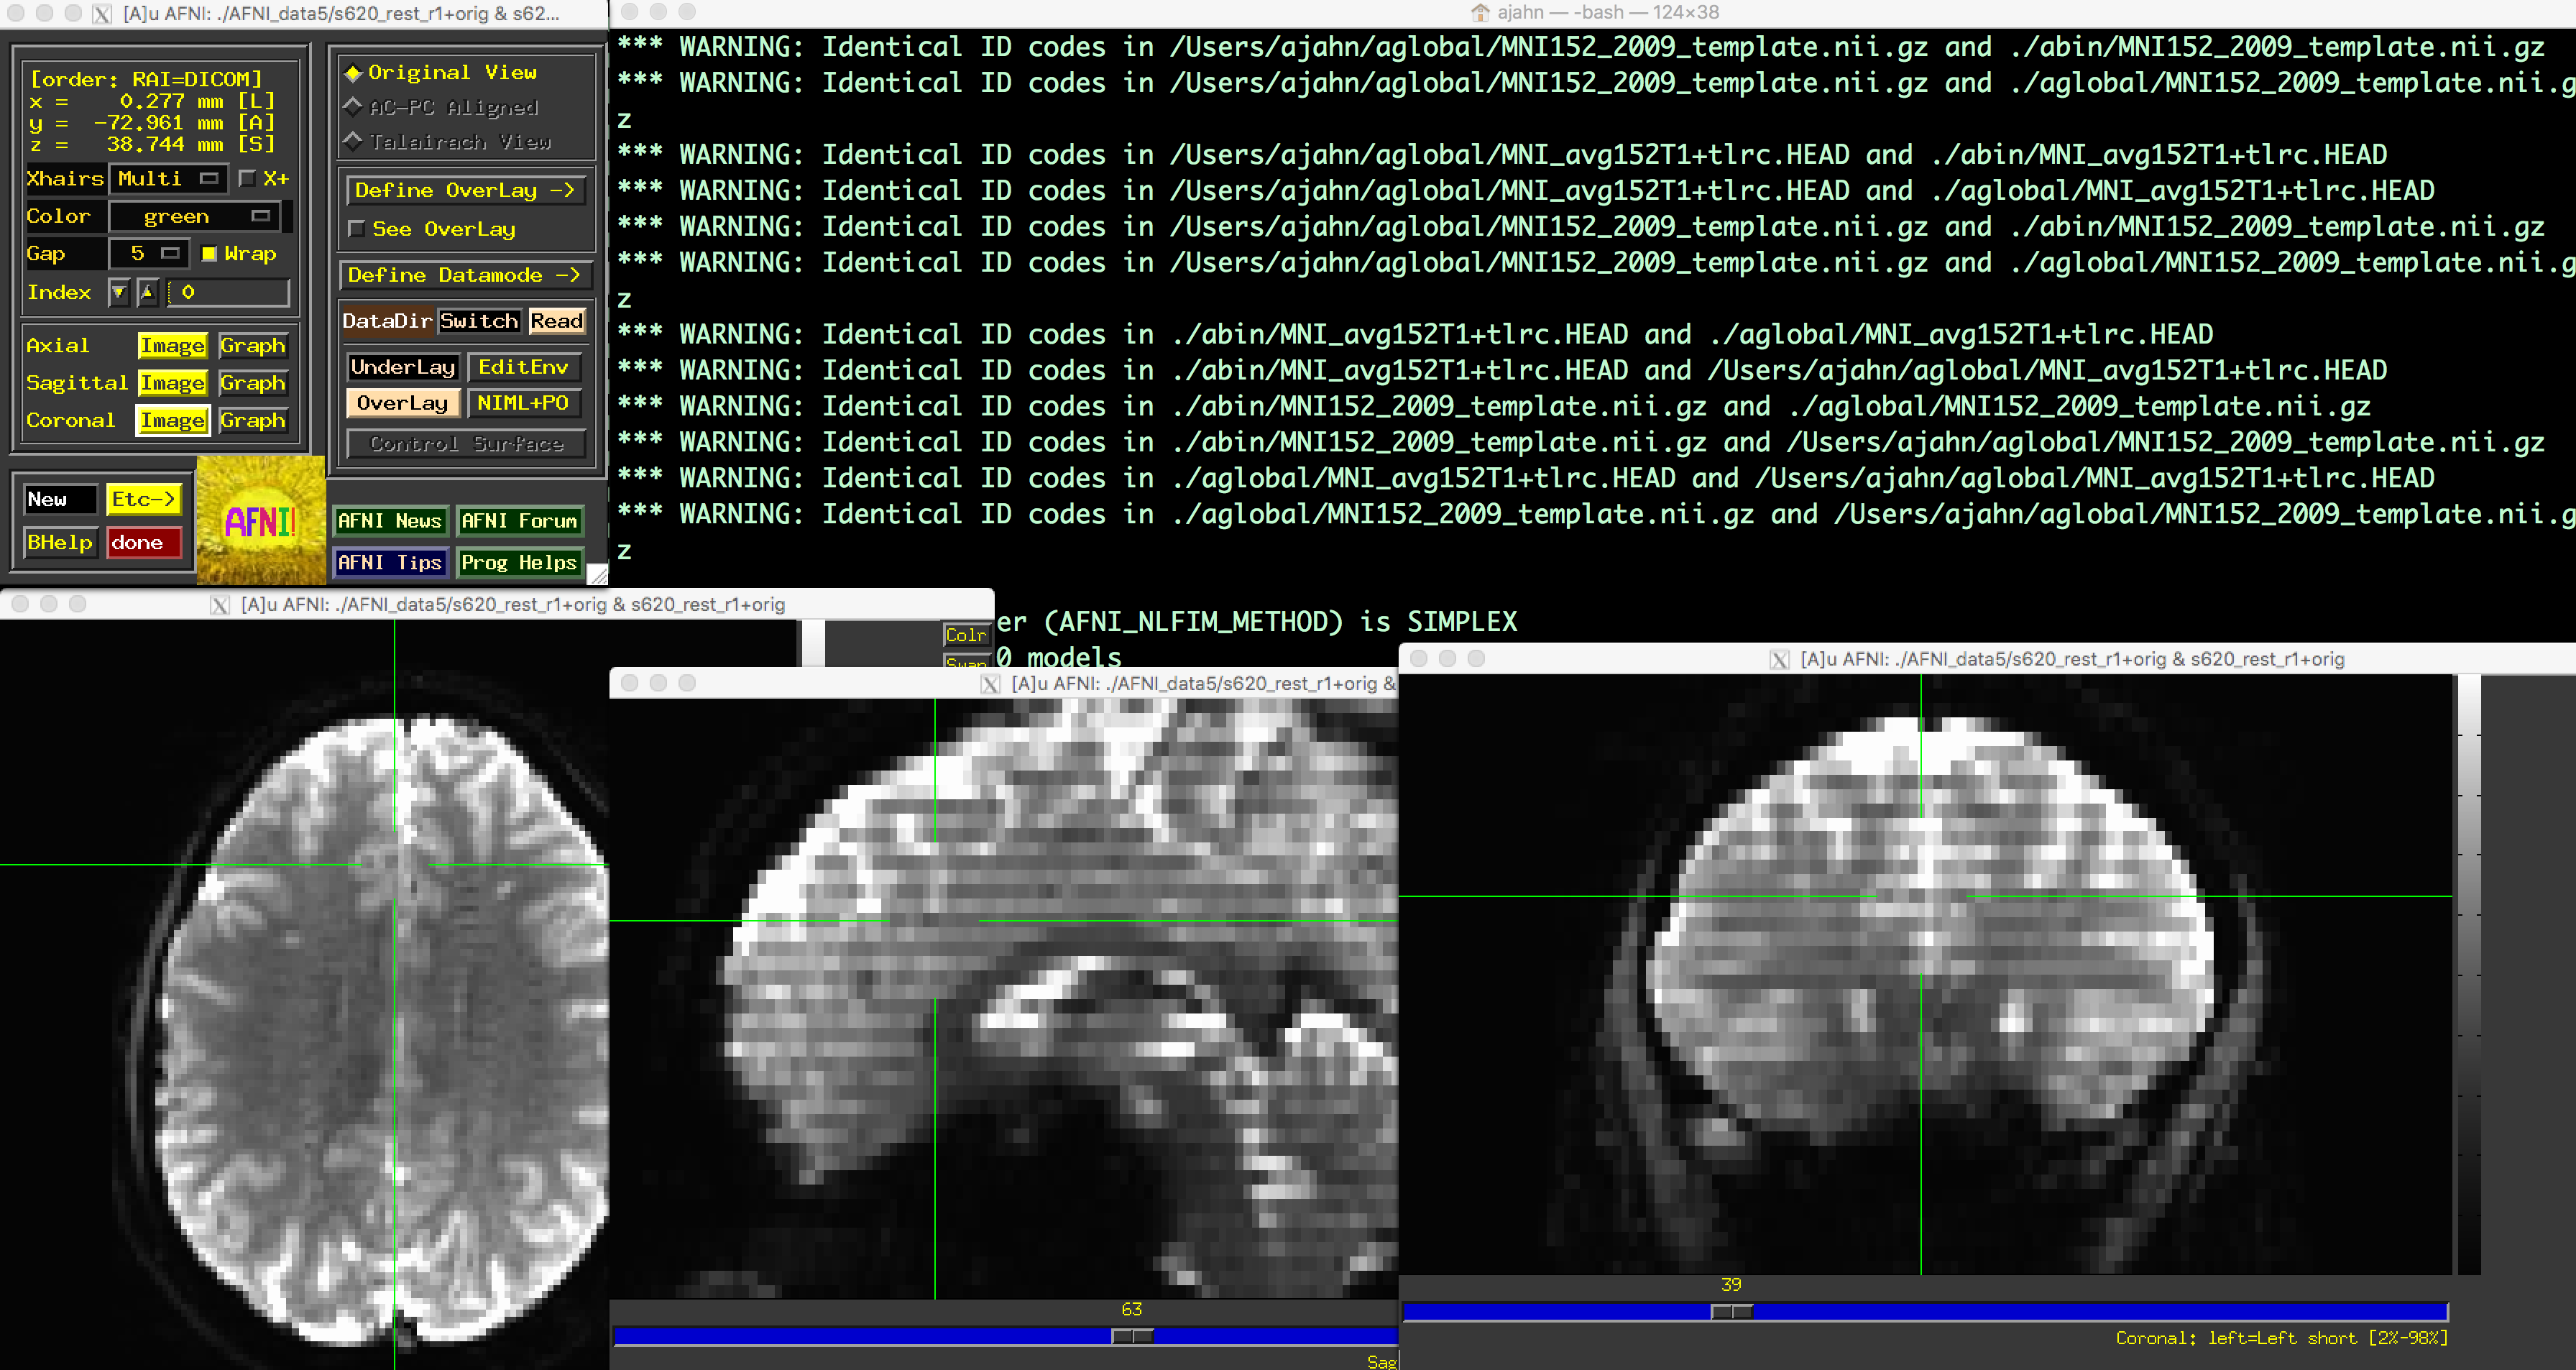
When you have successfully installed AFNI and typed afni from the command line, you should see something like this.
Note
This course will not be covering MRI physics in depth. For a review of that topic, I recommend chapters 1-5 of the book Functional Magnetic Resonance Imaging, by Huettel, Song, & McCarthy (3rd Edition). Also see Allen Elster’s excellent MRI Questions website for useful illustrations of MRI concepts.
Video
For a brief video introduction to AFNI and a walkthrough of how to download it, click here.